The Results Are In: What Our 2026 Corn Hybrid Plot Reveals
A closer look at yield, harvest moisture, and the importance of choosing the right hybrid for your acres.
When it comes to choosing corn hybrids, yield is usually one of the first numbers growers look at. But as every grower knows, the most bushels don't always mean the most dollars in your pocket.
Harvest moisture, drying costs, and hybrid performance all play a role in determining what you actually get out of your crop.
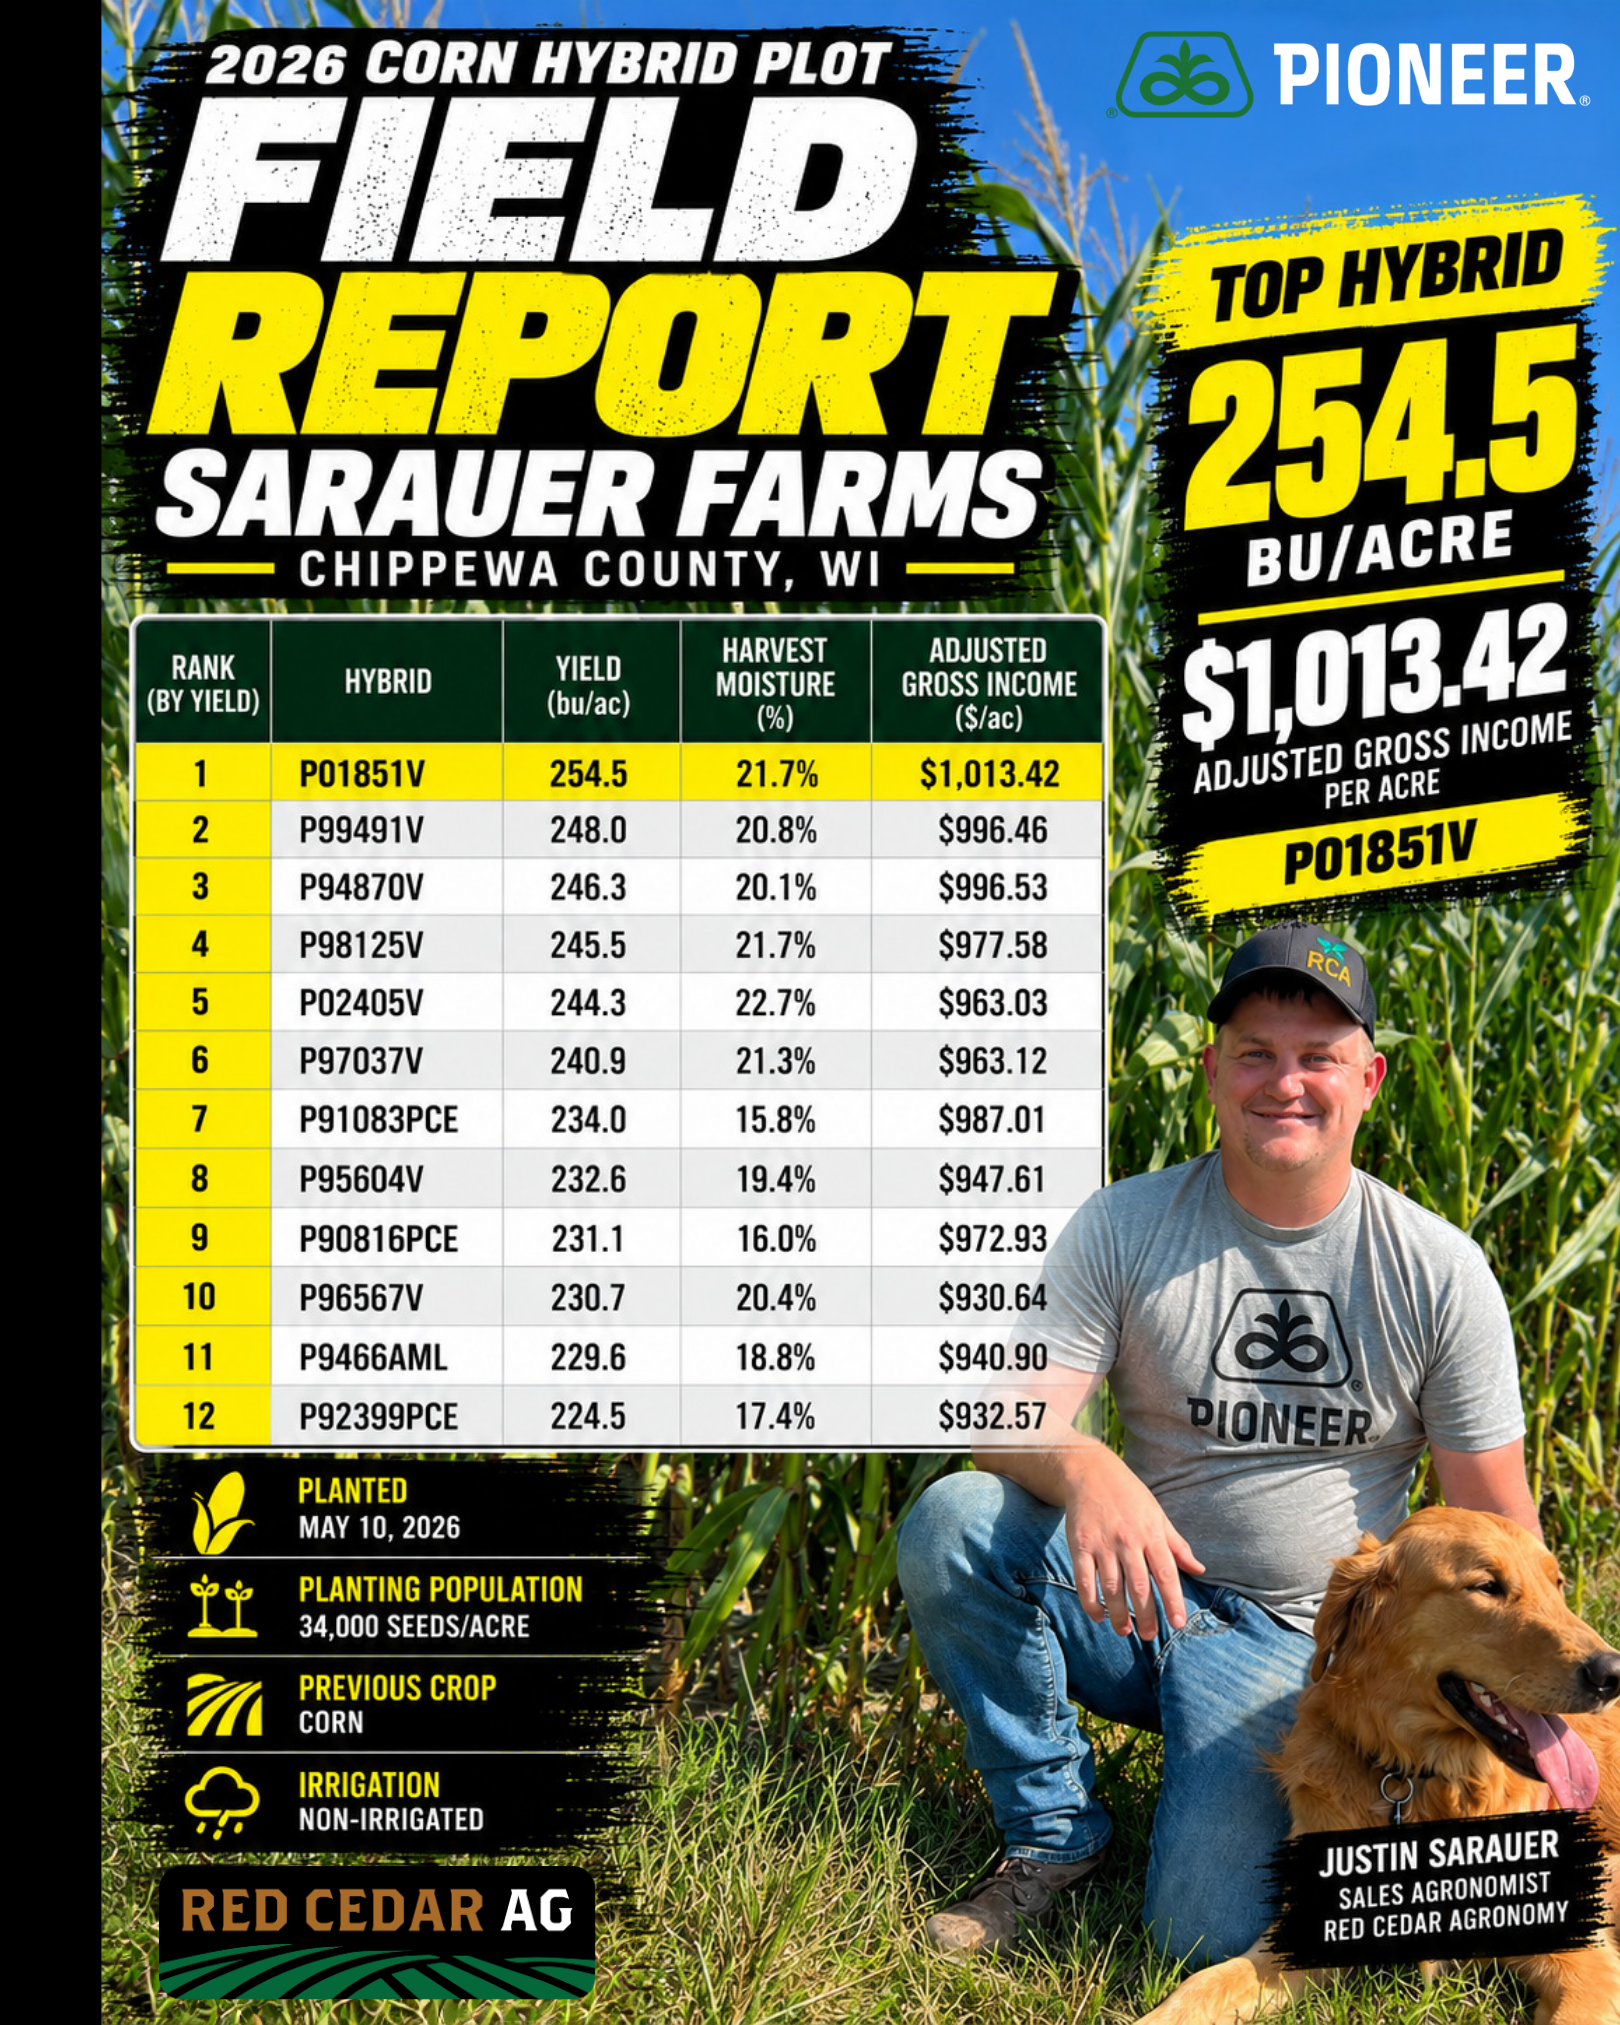
This fall, Red Cedar Agronomy's Justin Sarauer evaluated the performance of 12 Pioneer corn hybrids in a 2026 plot trial in Chippewa County, Wisconsin. The results offered a valuable look at how different hybrids performed under the same growing conditions, and why there's more to hybrid selection than chasing the highest yield.
Putting 12 Corn Hybrids to the Test

The trial was planted on May 10, 2026, in a non-irrigated field following corn. Each hybrid was planted at a population of 34,000 seeds per acre, providing an opportunity to compare performance under similar field conditions.
The results? Yields ranged from 224.5 to 254.5 bushels per acre, a 30-bushel difference between the highest- and lowest-yielding entries.
But yield wasn't the only measurement that varied.
Harvest moisture ranged from 15.8% to 22.7%, creating meaningful differences in the adjusted gross income (AGI) reported for each hybrid.
And that's where the results get interesting.
Does Higher Test Weight Mean Higher Yield? Not Necessarily.
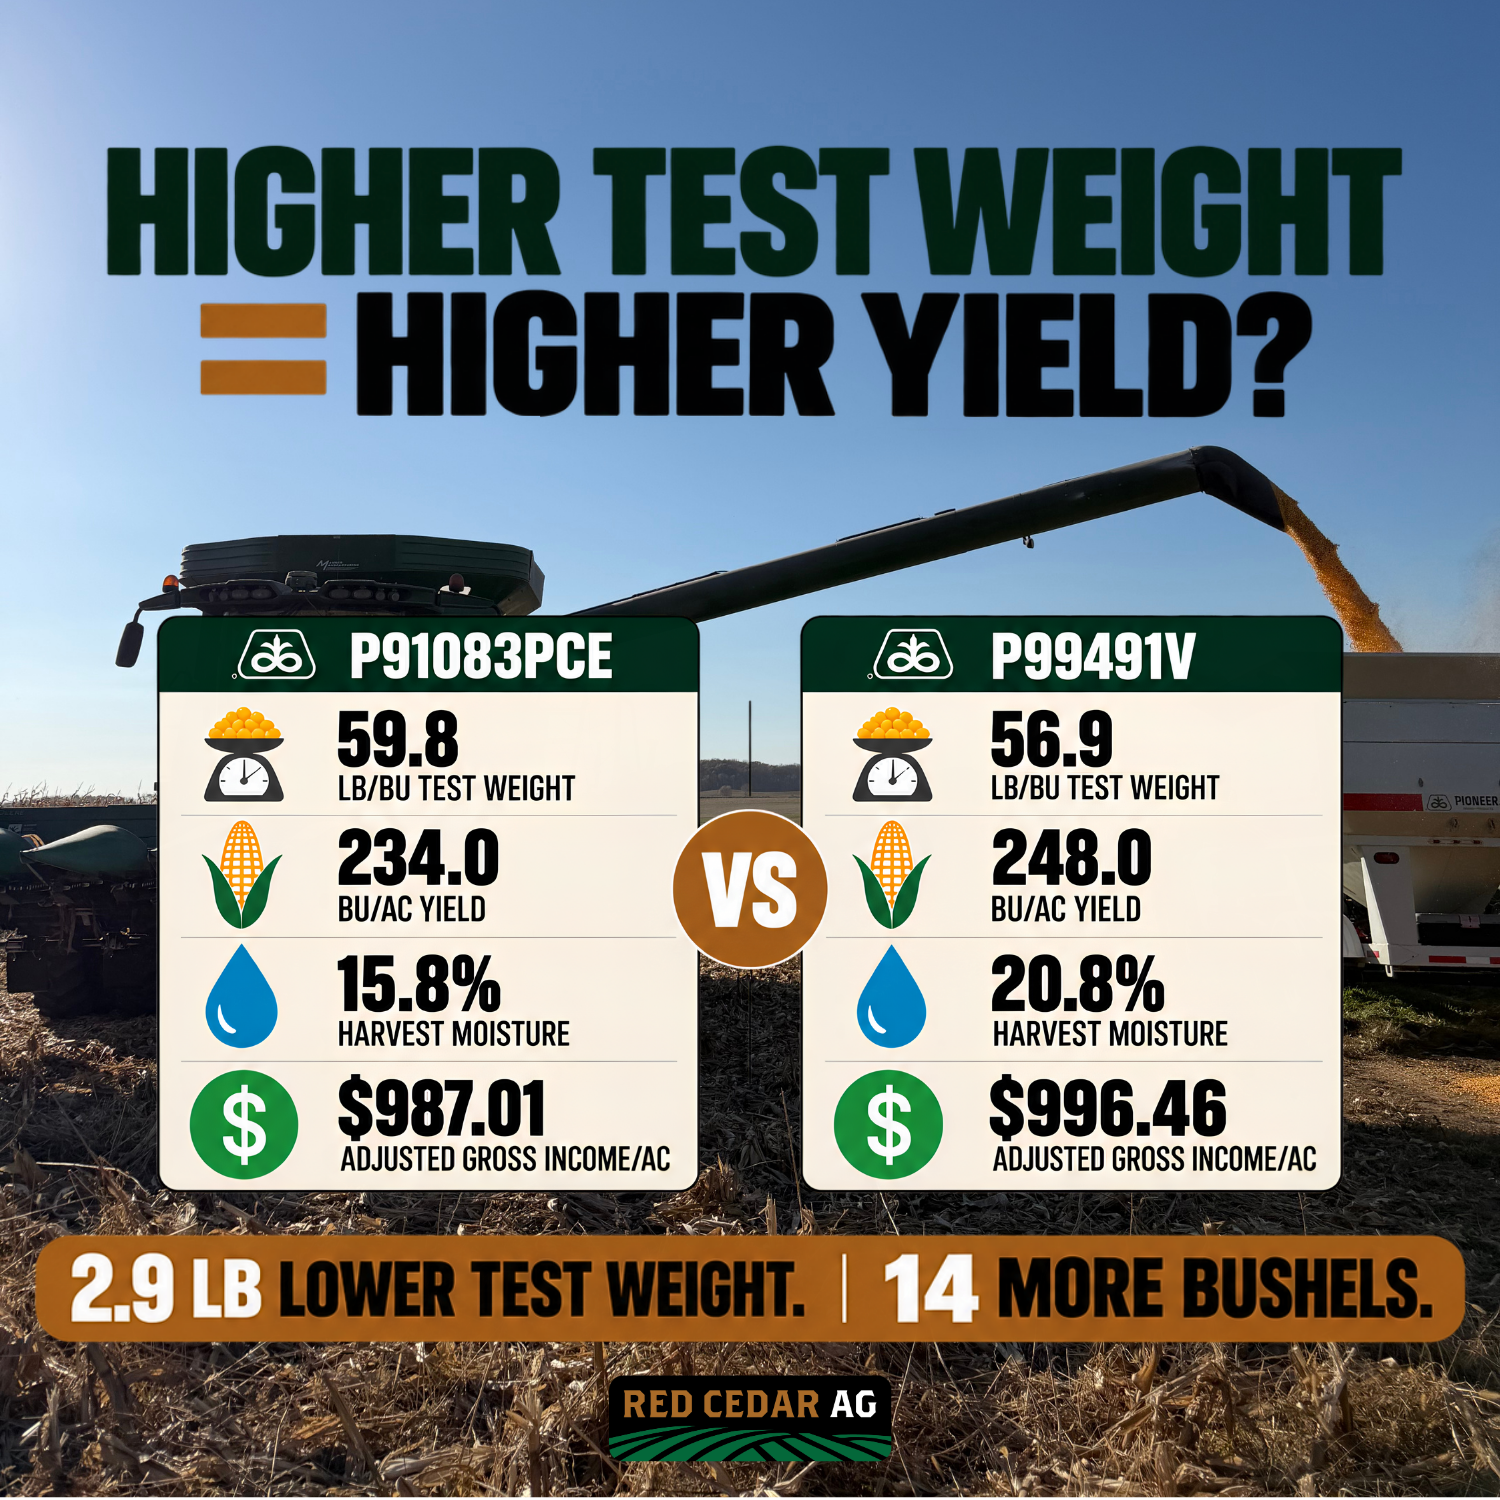
Another interesting finding from Justin's 2026 plot was the relationship between corn test weight and yield. It's easy to assume that heavier corn means more bushels, but that's not necessarily the case.
Take a look at these two Pioneer hybrids:
| Hybrid | Test Weight | Yield |
|---|---|---|
| P91083PCE | 59.8 lb/bu | 234.0 bu/ac |
| P99491V | 56.9 lb/bu | 248.0 bu/ac |

Despite having a test weight that was 2.9 lb/bu lower, P99491V produced 14 more bushels per acre.
How is that possible?
Test weight measures how much grain weighs within a standard bushel-sized volume, while yield measures the total amount of grain produced per acre, adjusted to a standard moisture level.

Corn is marketed by weight, with one standard bushel equal to 56 pounds at 15.5% moisture. That means a field can produce more bushels per acre even when its corn has a lower test weight.
So, Why Does Test Weight Matter?
While higher test weight doesn't automatically mean higher yield, it's still an important measurement to pay attention to for:
- Grain quality: Corn with a test weight below 54 lb/bu may face grade discounts, depending on the buyer's requirements.
- Storage: Lower-test-weight corn can be more challenging to store and may require closer management.
- Crop stress: Low test weight can sometimes indicate late-season stress, such as frost, disease, or poor grain fill.
- Hybrid selection: Different hybrids naturally produce different test weights, so it shouldn't be the only factor guiding your seed decisions.
The takeaway: Higher test weight doesn't guarantee higher yield, just as higher yield doesn't always guarantee higher adjusted gross income.
The Highest Yield Doesn't Always Mean the Highest Return
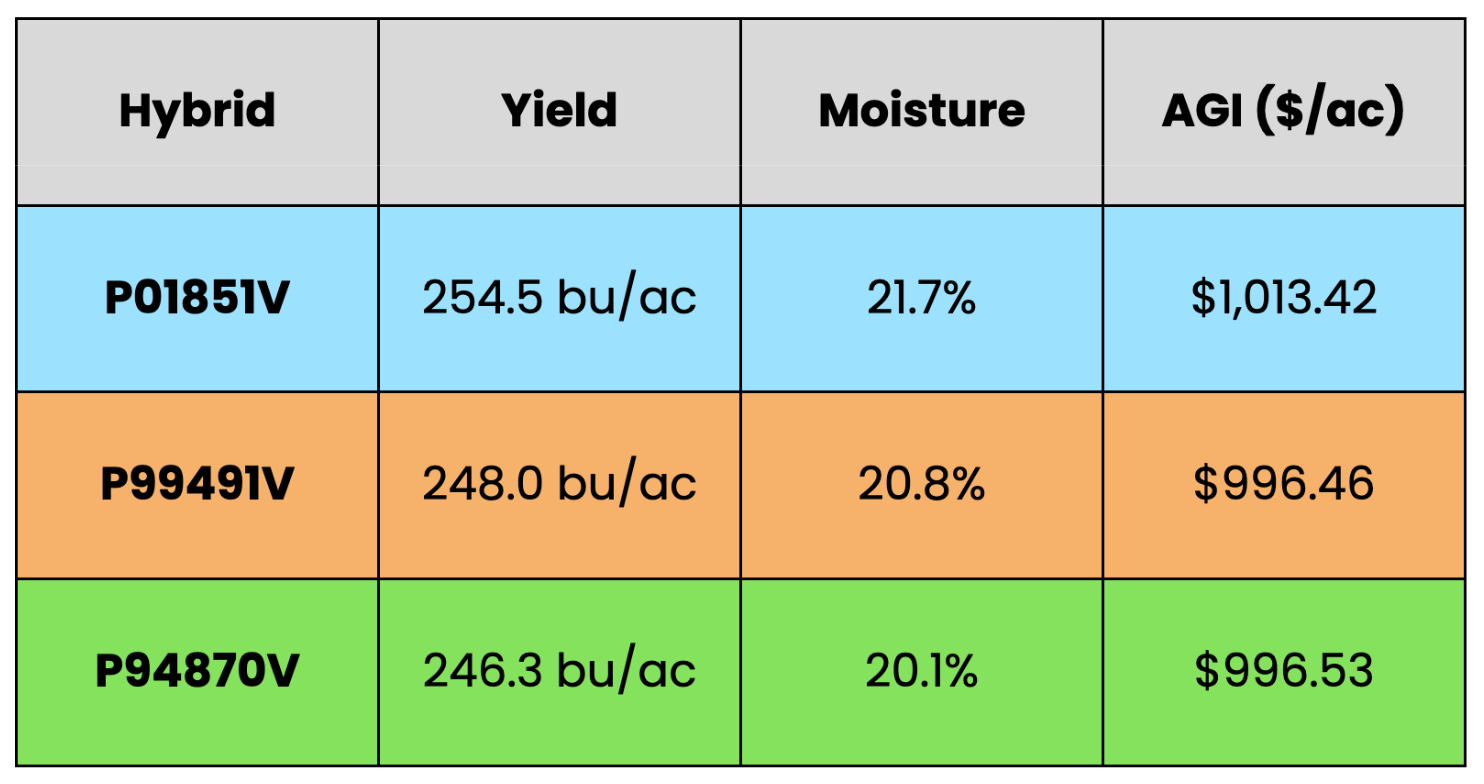
Pioneer P01851V topped the trial with an impressive 254.5 bu/ac, producing the highest reported adjusted gross income (AGI) at $1,013.42 per acre.
But looking at some of the other top-yielding hybrids reveals why bushels alone don't tell the full story.
Consider these three hybrids:

P99491V out yielded
P94870V by 1.7 bushels per acre. Yet
P94870V finished with a slightly higher adjusted gross income (AGI), despite producing fewer bushels.
Why? P94870V came out of the field at 20.1% moisture compared to 20.8% for P99491V. That difference in harvest moisture helped offset its lower yield, resulting in nearly identical AGI.
The takeaway: A few extra bushels don't necessarily translate into more dollars per acre when harvest moisture is factored into the equation.
Sometimes, Drier Corn Can Make Up for Lower Yields
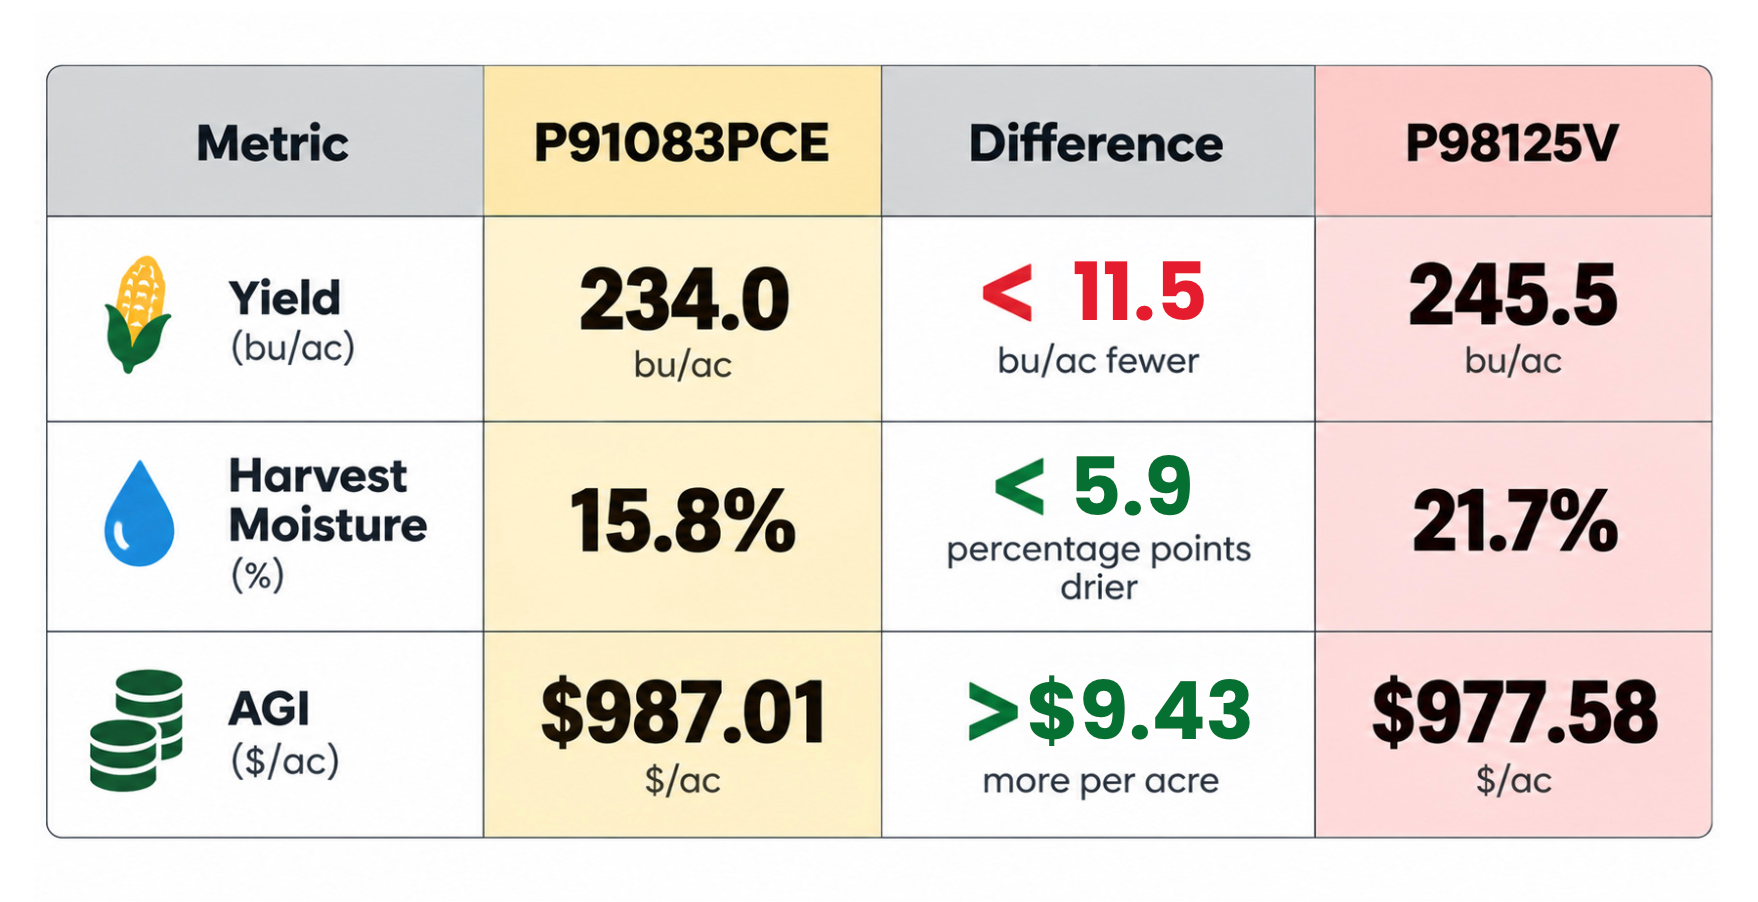
One of the more interesting results came from Pioneer P91083PCE. At 234.0 bu/ac, it wasn't among the highest-yielding hybrids in the trial. However, it had the lowest harvest moisture at just 15.8%. That combination resulted in an adjusted gross income (AGI) of $987.01 per acre.
Compare that to
P98125V, which produced 245.5 bu/ac at 21.7% moisture and an AGI of $977.58 per acre.
Despite yielding 11.5 fewer bushels per acre,
P91083PCE generated $9.43 more in adjusted gross income per acre.

This is a great example of why harvest moisture deserves a place in the conversation when evaluating hybrid performance.
Higher-moisture corn may require additional drying, which can affect the value of those extra bushels. Depending on your drying setup, harvest timing, and marketing strategy, a slightly lower-yielding hybrid with lower moisture may still be a competitive option.
Despite producing 11.5 fewer bushels per acre,
P91083PCE had 5.9 percentage points lower harvest moisture and generated $9.43 more in adjusted gross income per acre.
What Can Growers Learn From These Results?
There's no single corn hybrid that's the perfect fit for every acre.
Different fields have different soil types, drainage, fertility levels, and management needs. A hybrid that performs well in one environment may not deliver the same results in another.
That's why evaluating plot data means looking beyond the top yield number.
When reviewing hybrid performance, consider:
- Yield potential: How much grain did the hybrid produce?
- Harvest moisture: How dry was the corn coming out of the field?
- Adjusted gross income: How did yield and moisture affect the reported economic return?
- Field fit: How well does the hybrid match your soil conditions, management practices, and yield goals?
It's also important to remember that these results represent one location and one growing season. While they provide useful insight, they shouldn't be the only factor guiding your seed decisions.
The goal isn't necessarily to find the hybrid with the highest yield in a single plot. It's to find the hybrids that consistently make sense for your acres and your operation.
Turning 2026 Results Into Better 2027 Decisions
With harvest wrapping up, now is a great time to look back at what worked, what didn't, and where there may be opportunities to improve next season.
Plot trials like this one help put real numbers behind seed recommendations. By comparing yield, moisture, and adjusted gross income, growers can make more informed decisions about which hybrids deserve a place in their 2027 lineup.
At Red Cedar Agronomy, we're focused on helping you make those decisions with data, not guesswork.
Want to take a closer look at the results or talk through your 2027 hybrid selection?
Contact Justin
Data source:
2026 PioneerTRIALS Location Summary Report, Chippewa County, Wisconsin. Results represent one trial location and should not be interpreted as a guarantee of future hybrid performance. Adjusted gross income reflects the report's economic assumptions and is not equivalent to net profit.